Much more than a debugger
Designed to take your Clojure interactive programming to the next level.
Have all the debugging power no matter what editor/IDE you choose.
Whenever it can, FlowStorm tries hard to provide the same features for Clojure and ClojureScript.
FlowStorm is and will always be free as in speech. So no money involved and use it however you like.
Clojure as most Lisps are designed from the ground to support interactive programming, so it is FlowStorm.
Every situation requires a different strategy. From stepping, trough printing, to scope capturing and repl poking, FlowStorm tries to support all debugging strategies.
Most of the provided tools are great for chasing bugs, but FlowStorm is designed not only as a debugger but as a development sidecar to enhance your interactive programming experience.
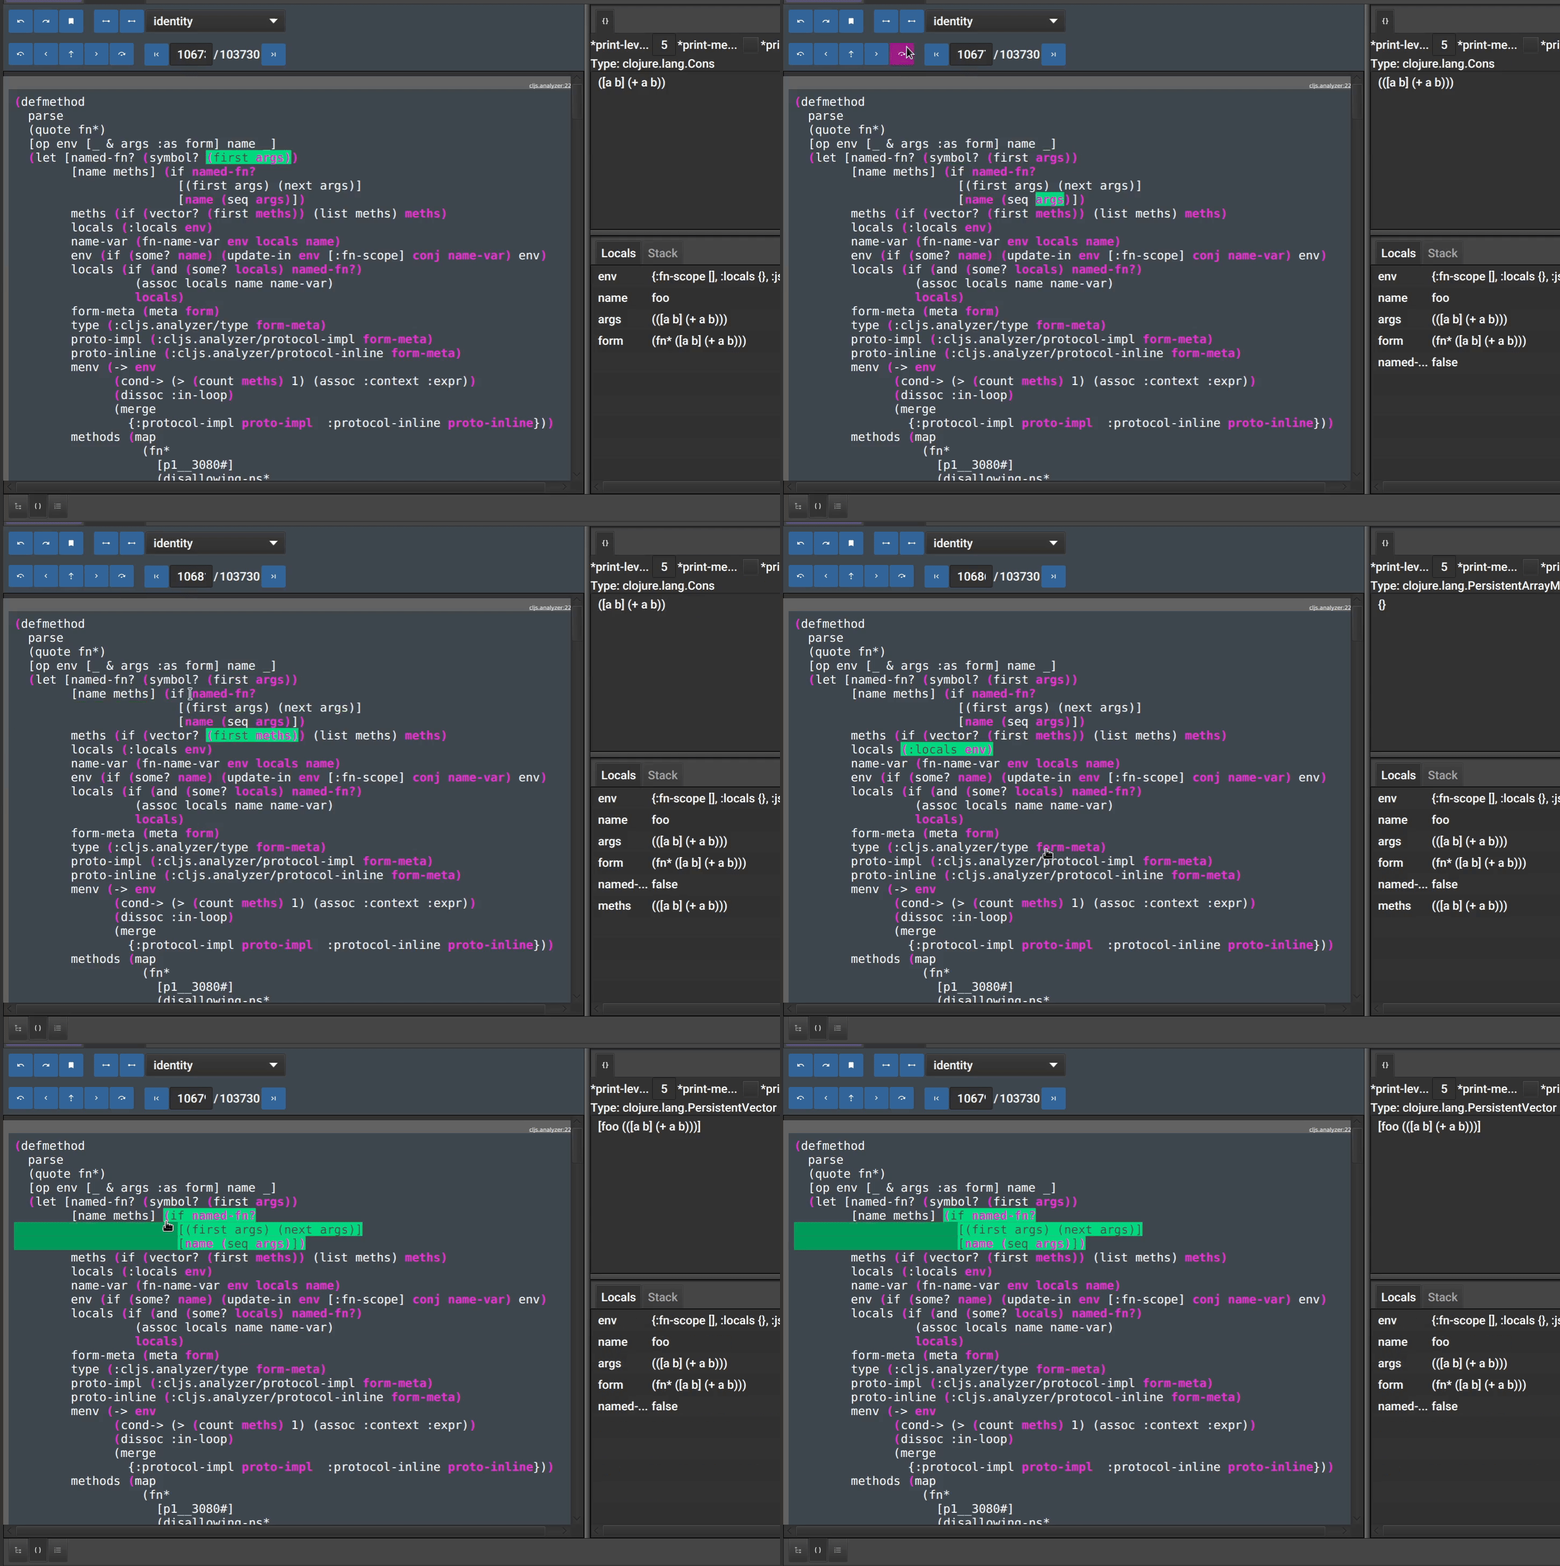
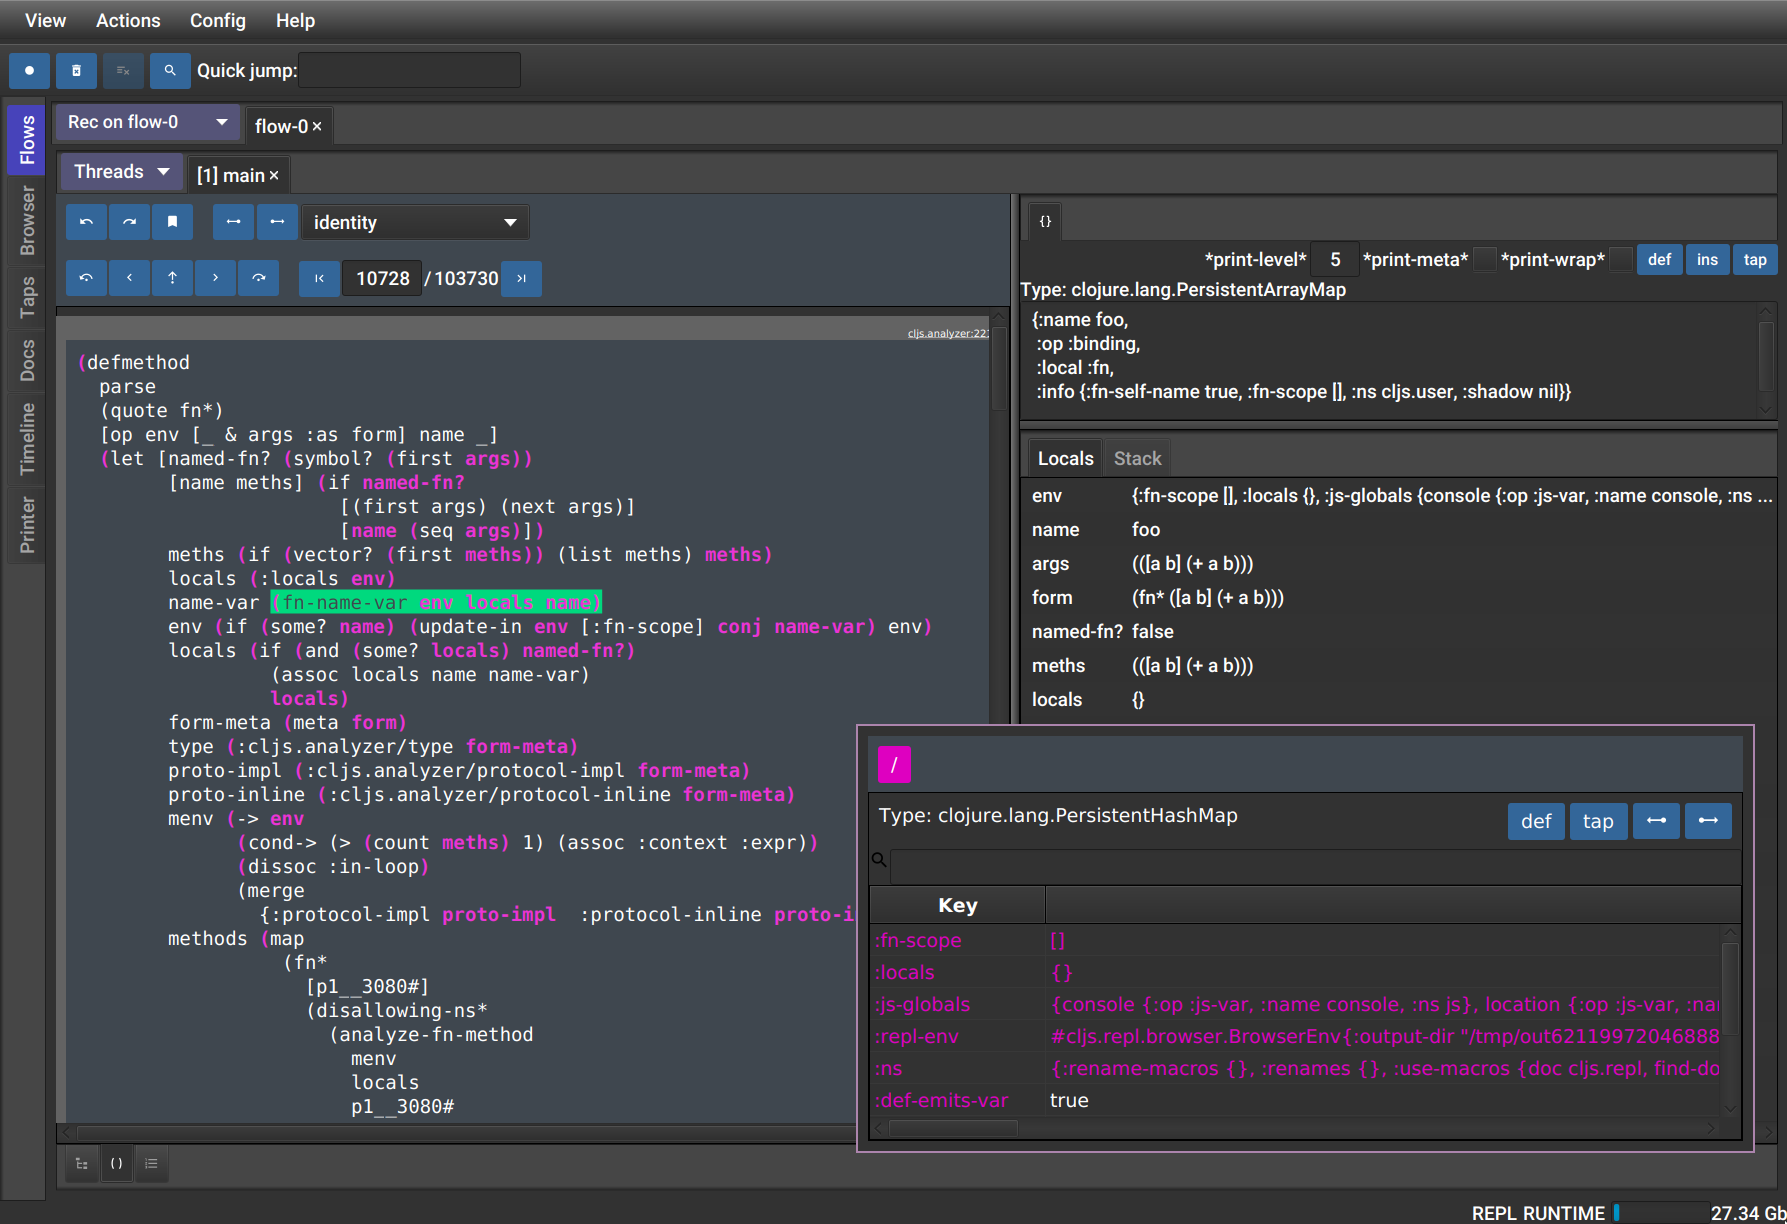
Step freely through your code
Hit record and debug anything. No need to add breakpoints or modify your code.
Learn MoreRealtime visualizations
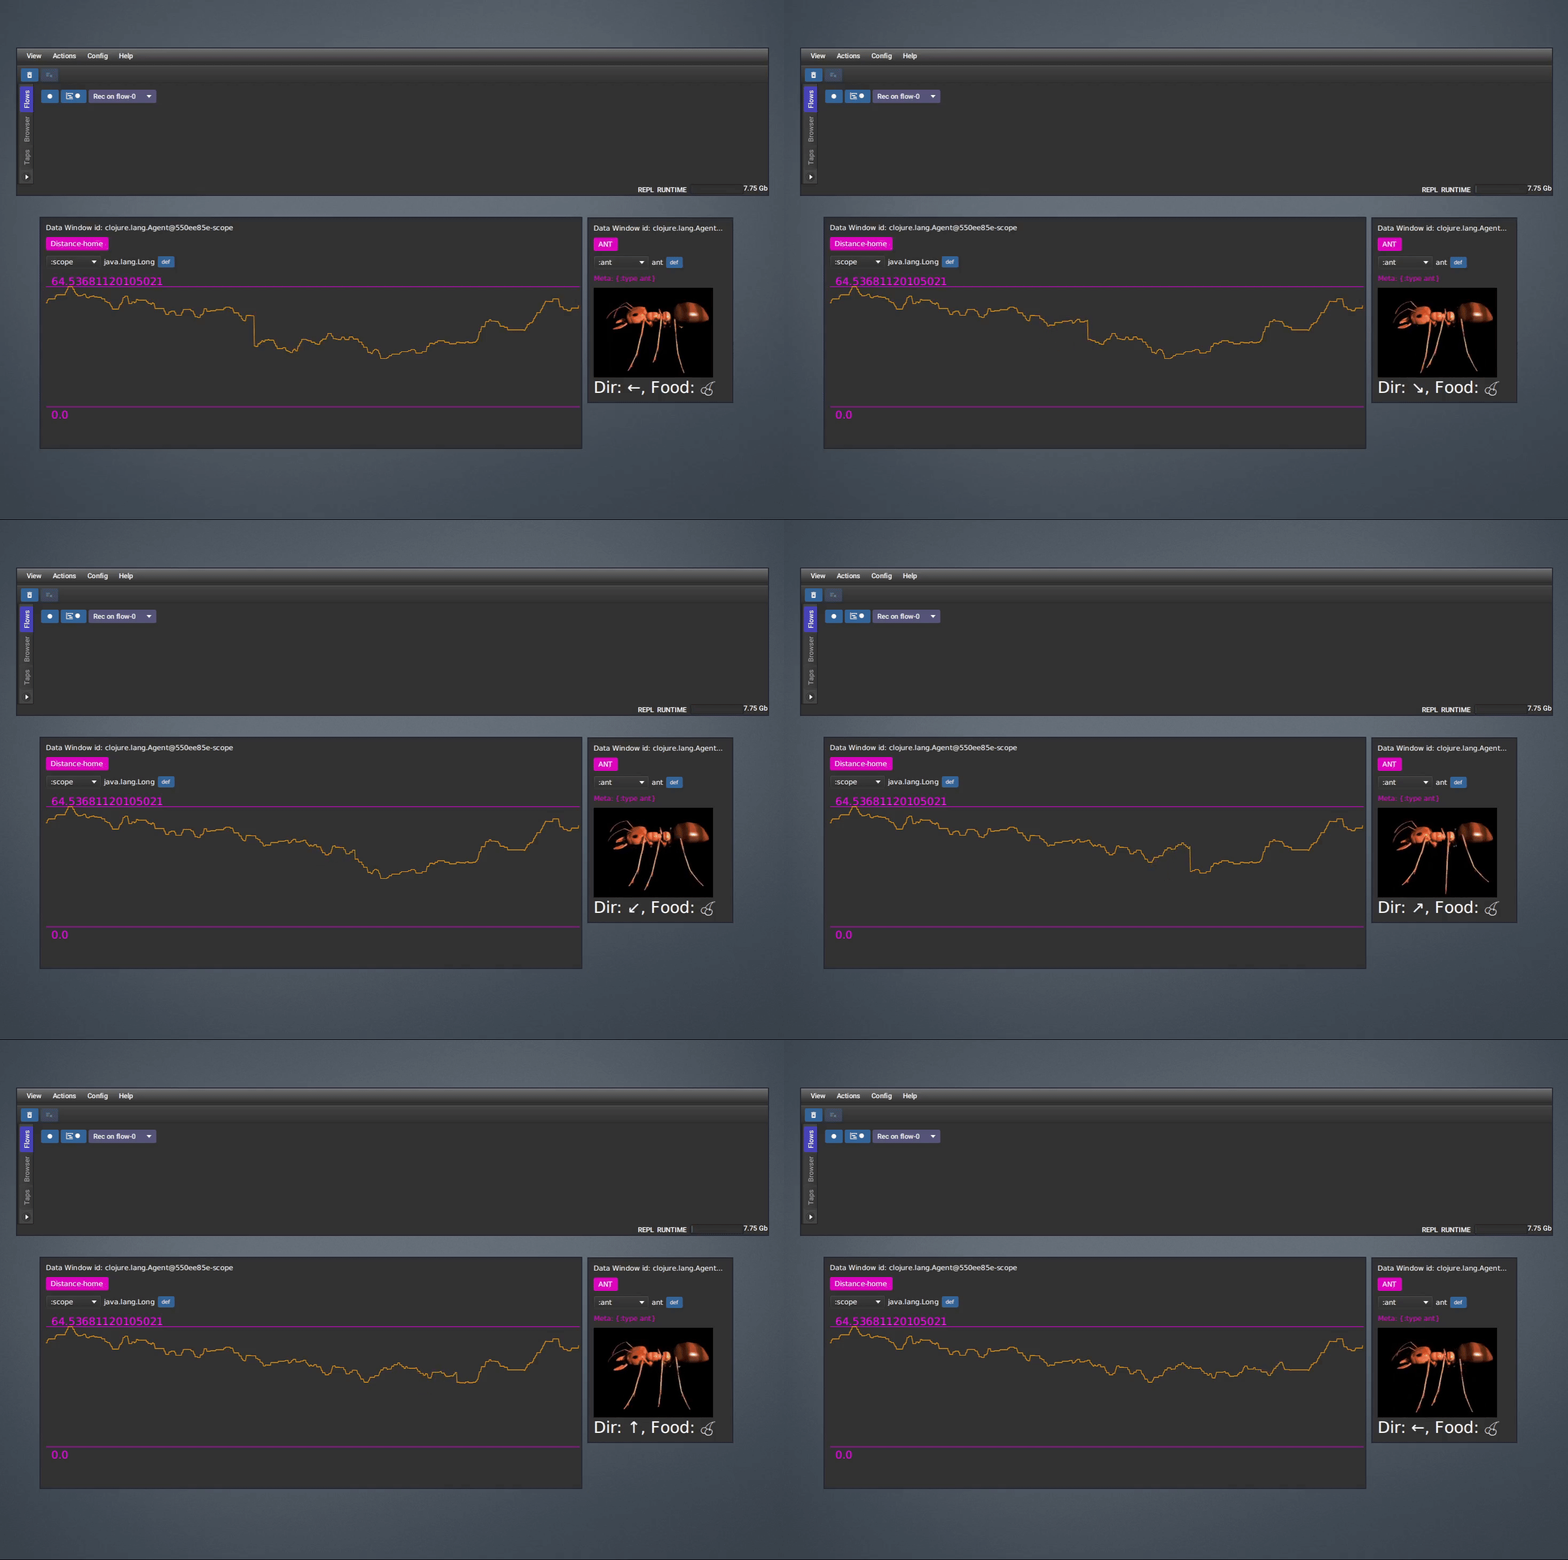
Visualize changing data in real time, with custom visualizations.
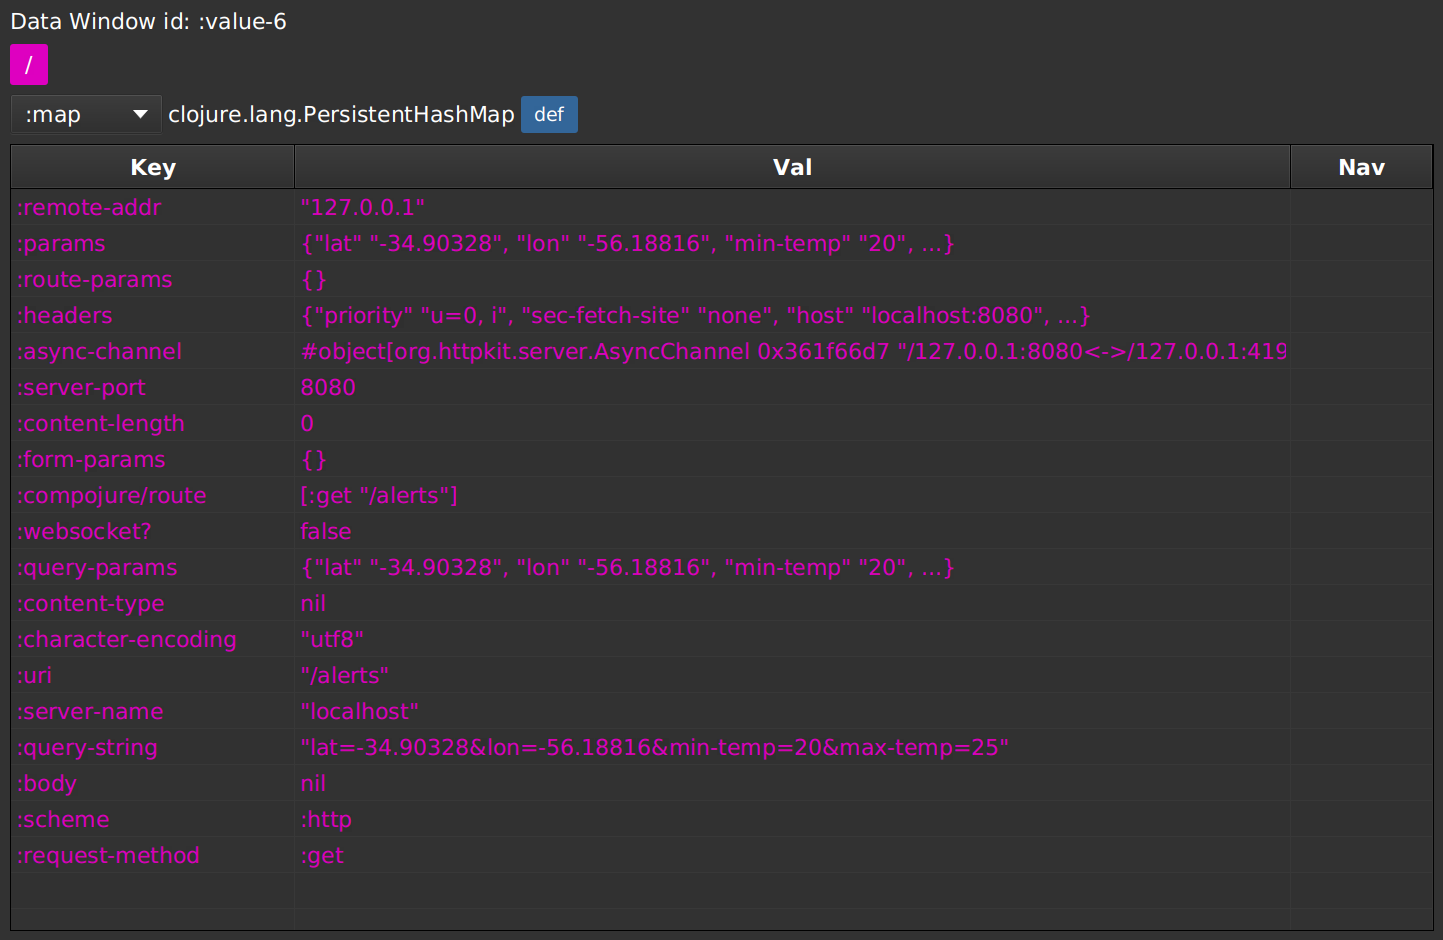
Learn MoreCustomizable data visualizations
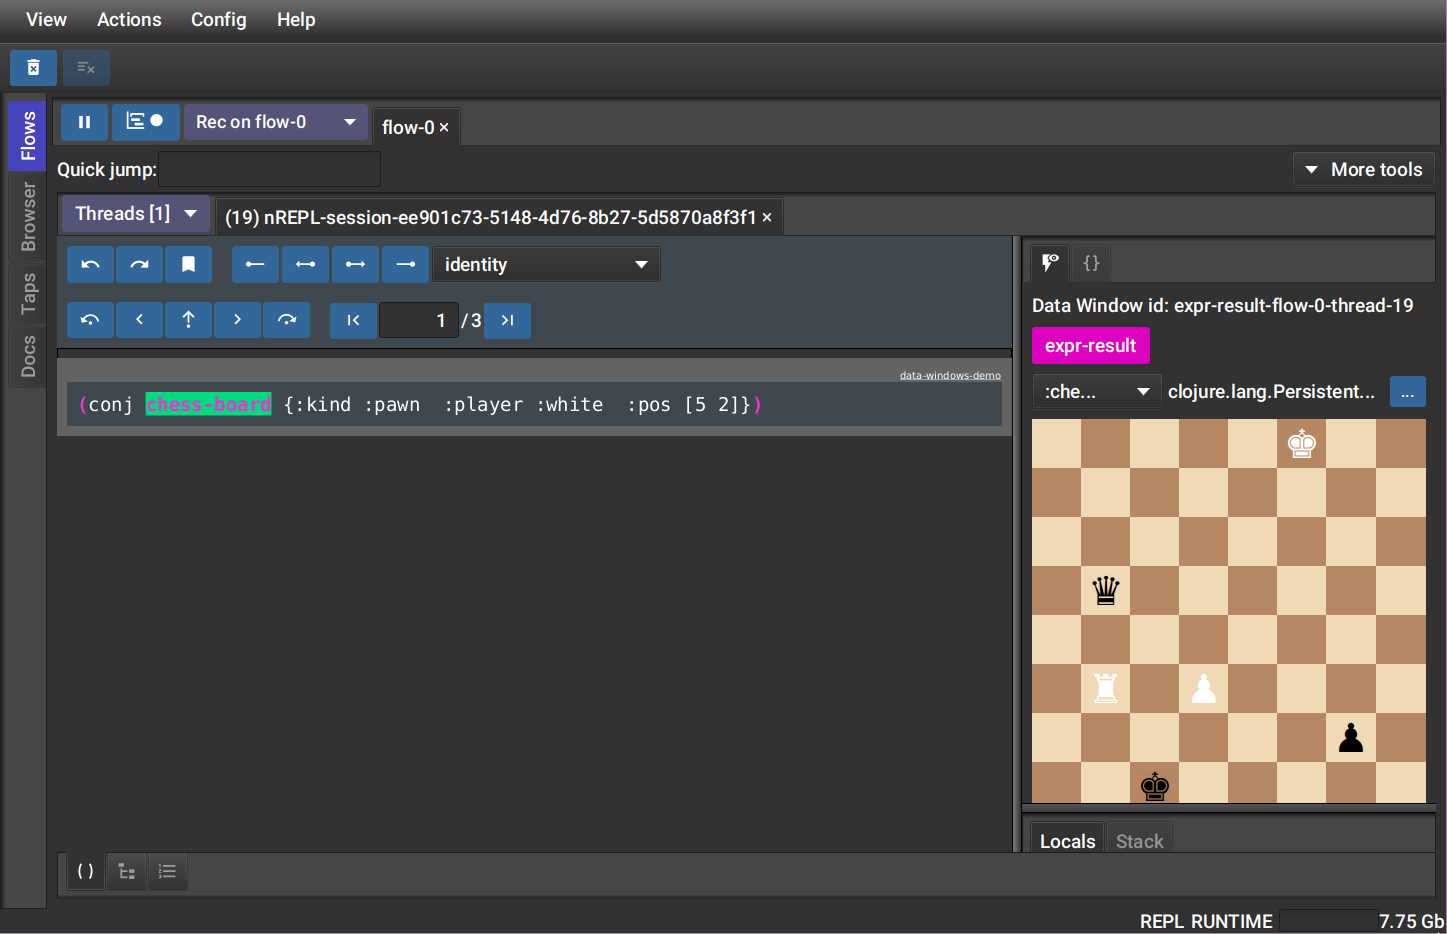
FlowStorm data windows allows you to explore and visualize your data in customizable ways.
Learn MoreFollow the values
Ever wonder how a value got there?
Use the power stepping tools to track any value as it moves through your program.
Jump around
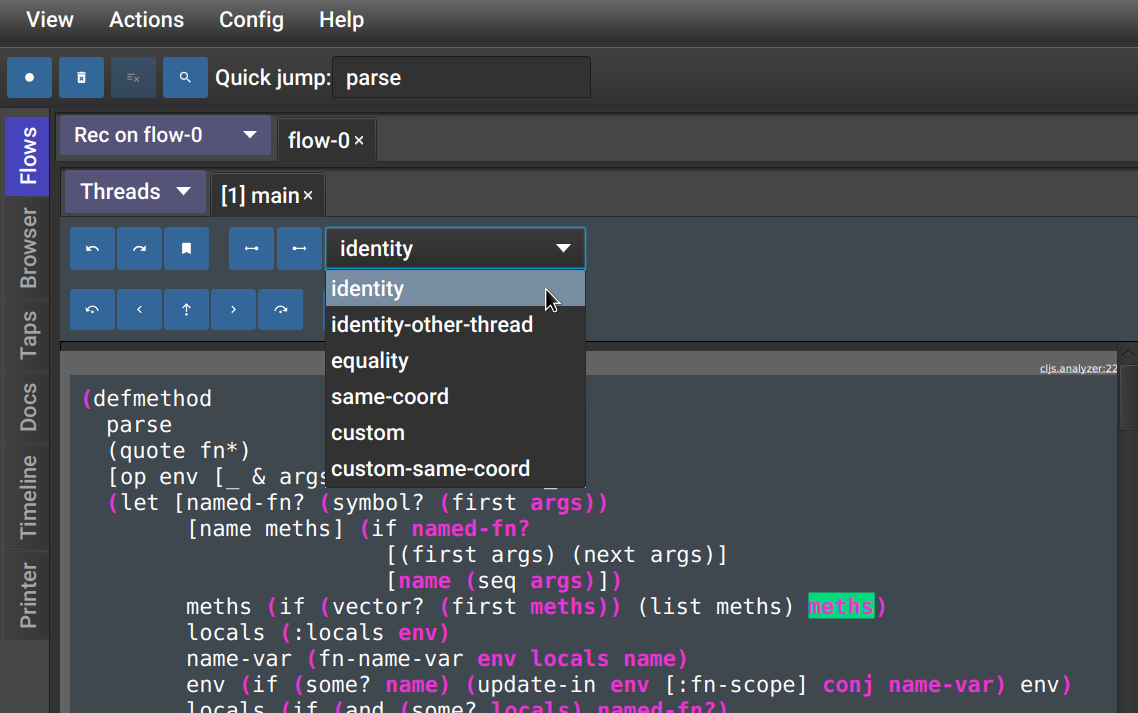
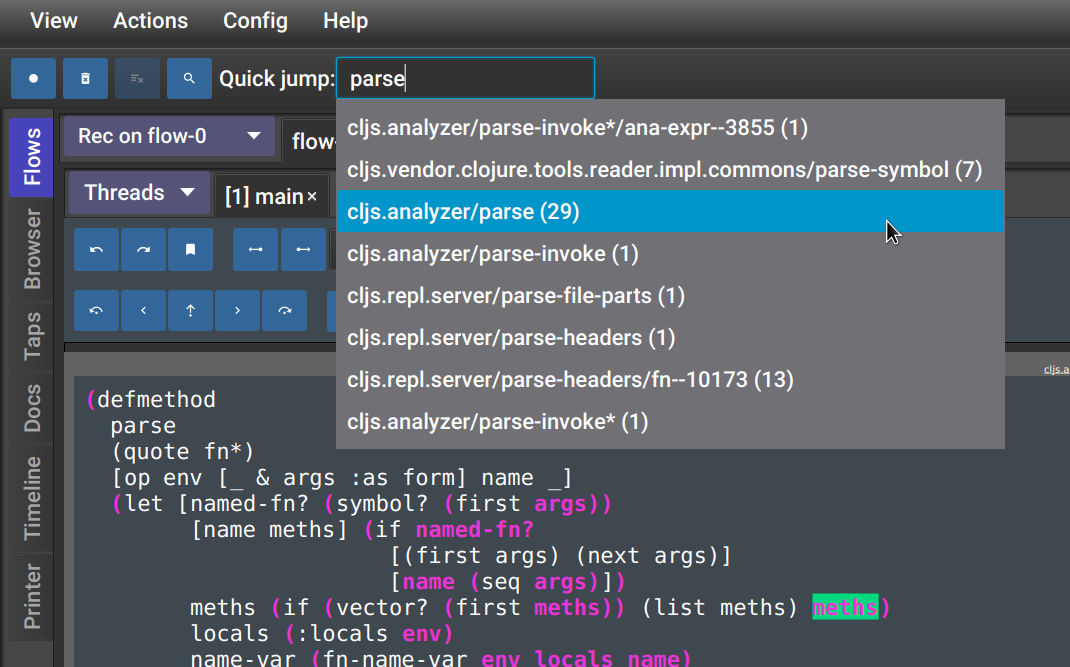
FlowStorm is designed to be part of your workflow, so jumping around should be fast. Type your function name, then instantly navigate to step over it.
Learn MoreExplore your call tree
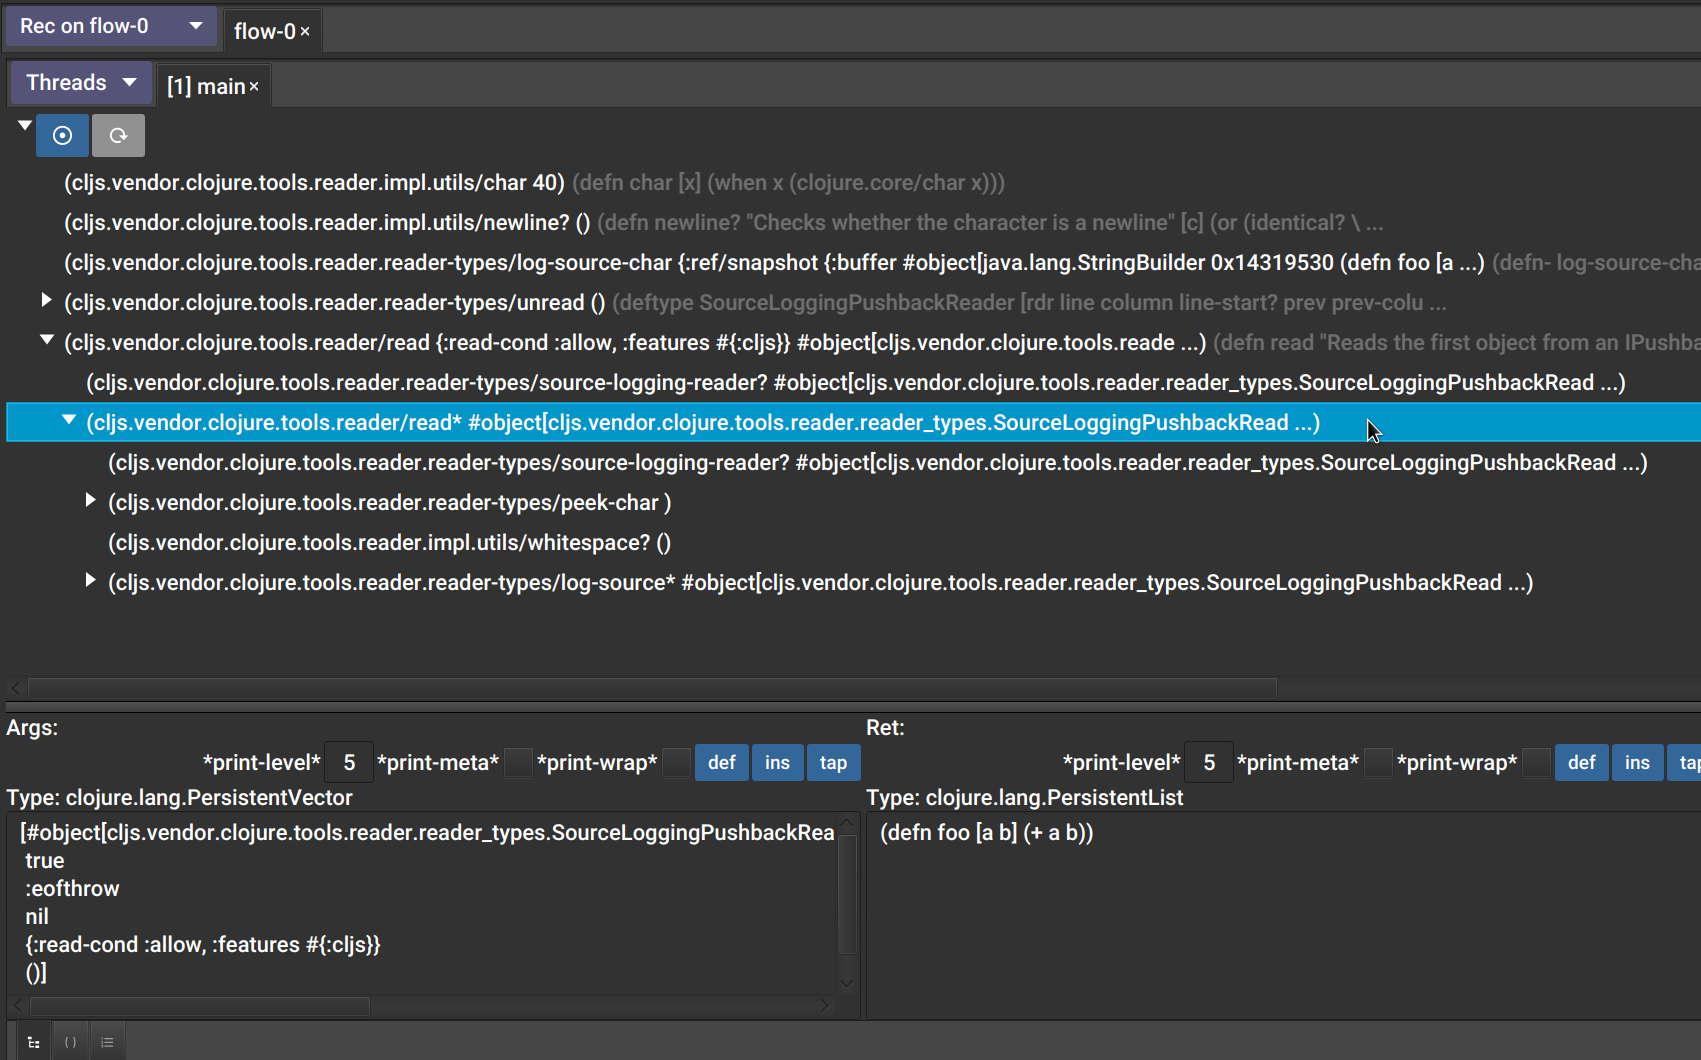
Get a high level understanding of your execution by expanding and exploring the call tree. Need to go deeper? Just click and jump to that point in time.
Learn MoreUnderstand your functions
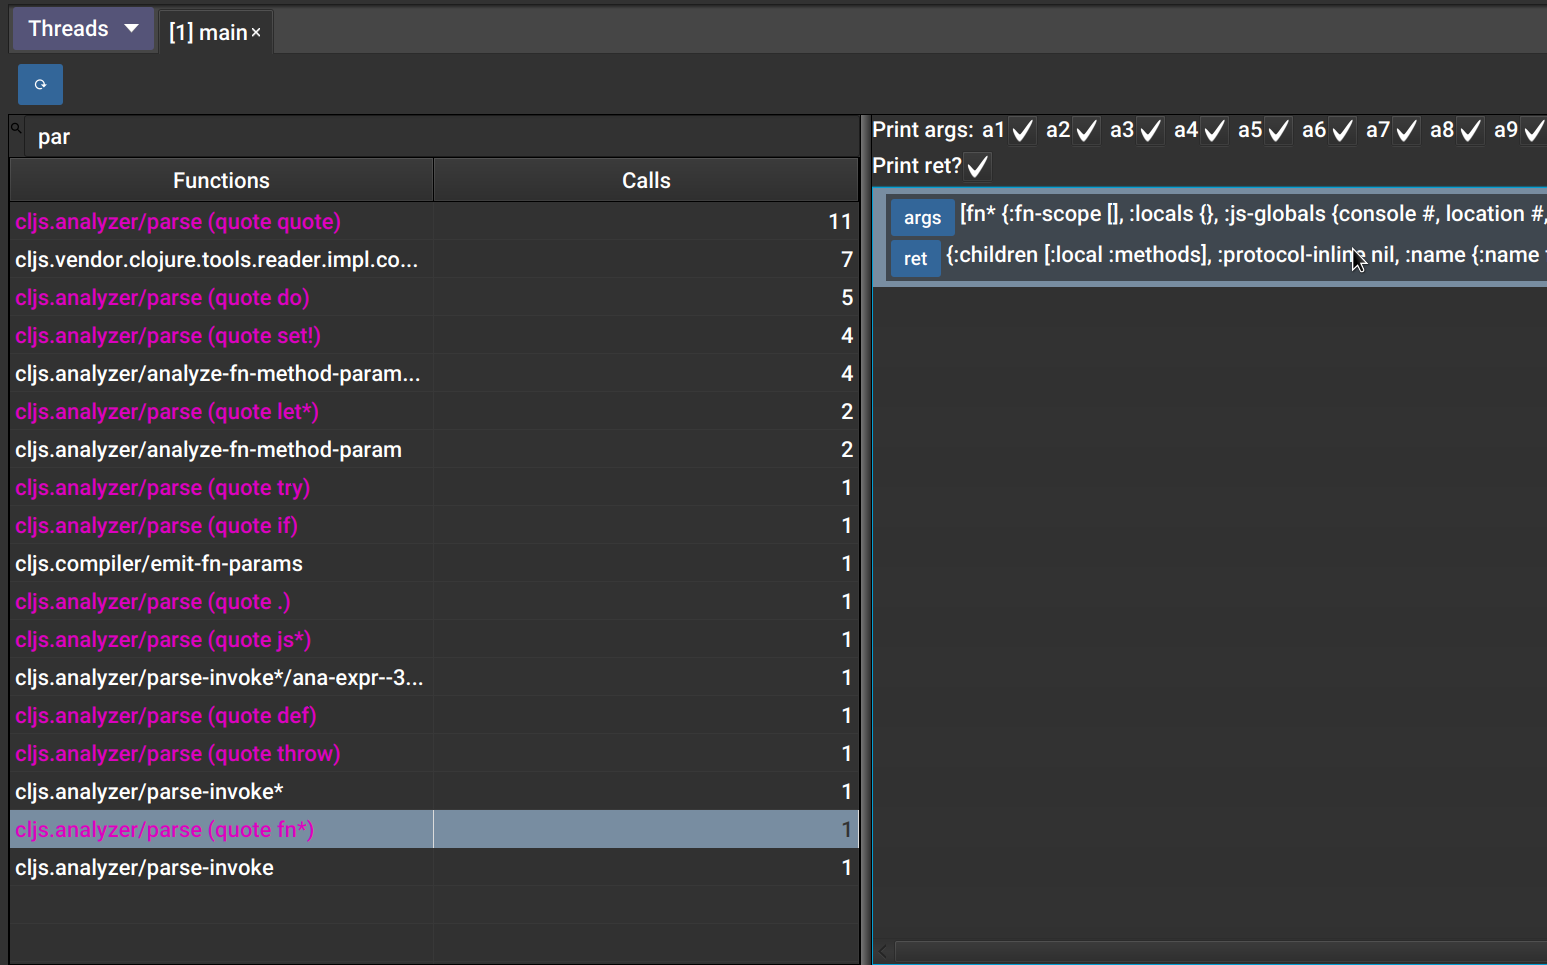
Get a high level view of your functions and how they are being called. Easily explore their arguments and return values. Need to go deeper? Just click and step through its code.
Learn MoreInspect your values
Clojure is data oriented. FlowStorm provides a powerful data inspection tool. Navigate freely into your data just by clicking around.
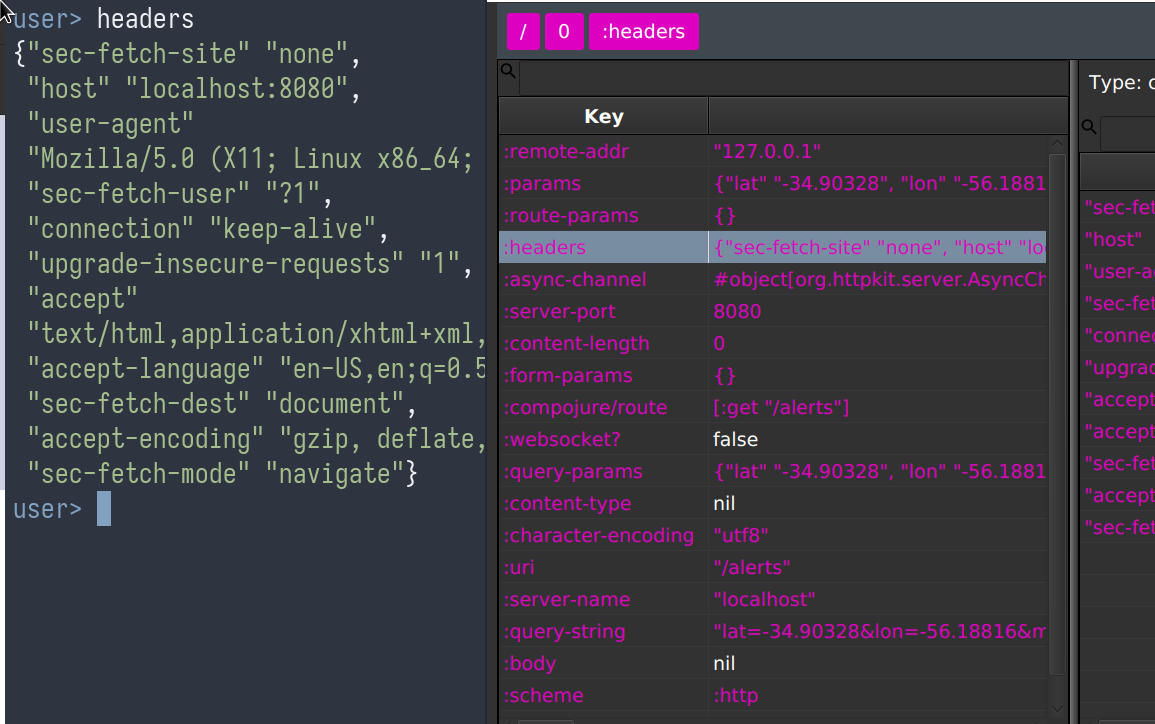
Learn MoreTake any value back to your REPL
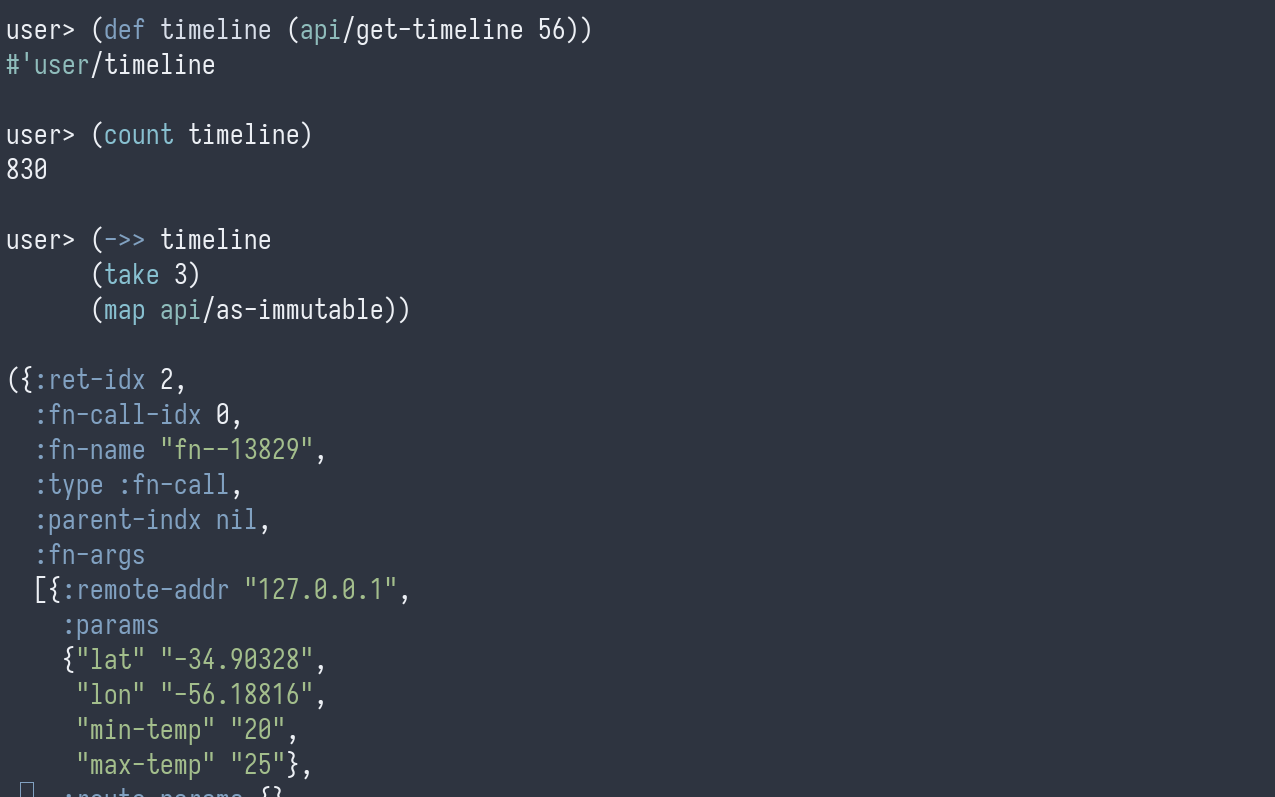
FlowStorm is designed for interactive programming. Any value you see in the UI can be made available to your REPL with a single click.
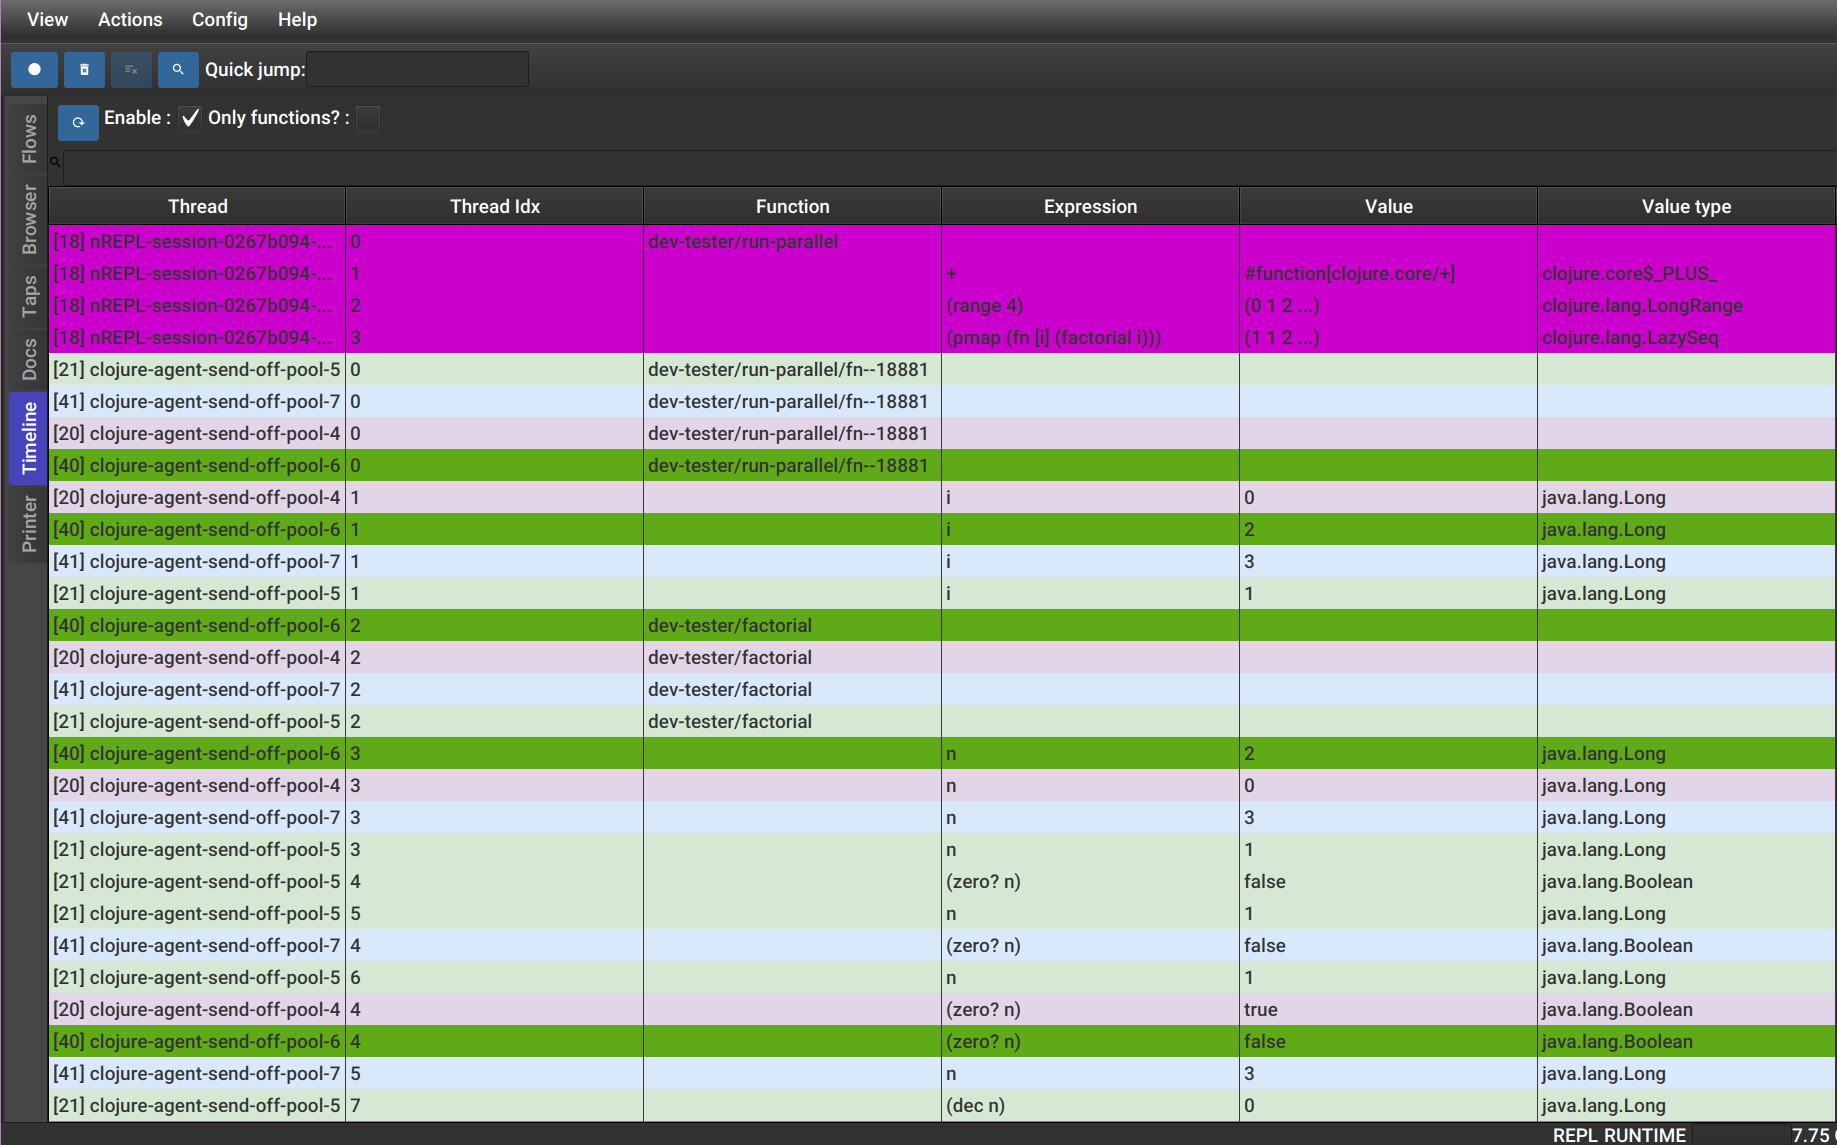
Learn MoreMulti-threading debugging with the timeline
Render your entire executions timeline. Quickly understand how your threads instructions interleave.
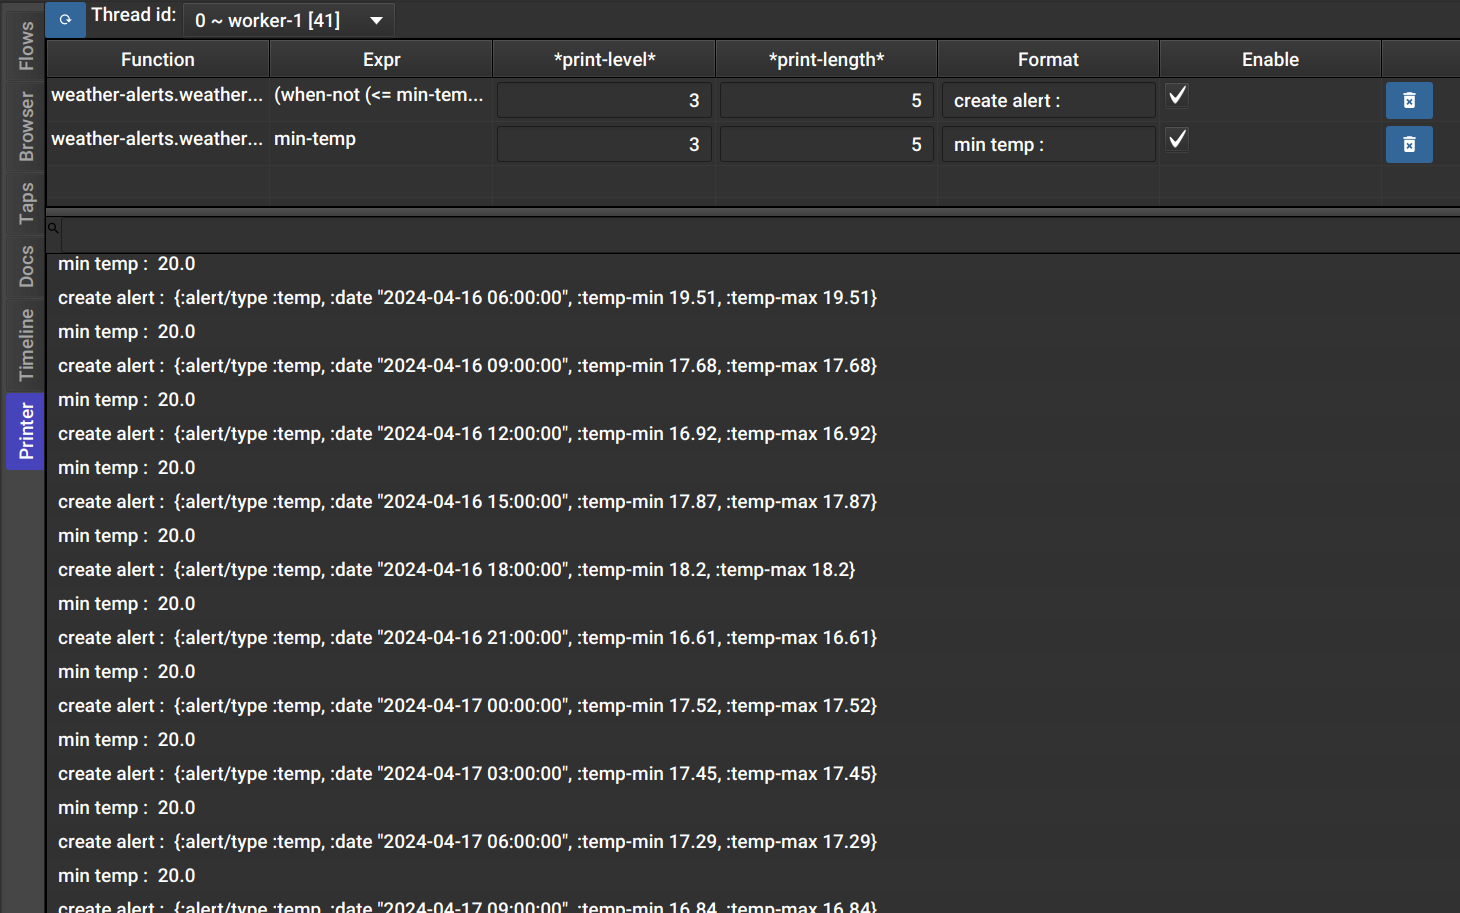
Learn MoreNext level println debugging
For those cases where println is still the right choice, add, manage and visualize print instructions without re running your code.
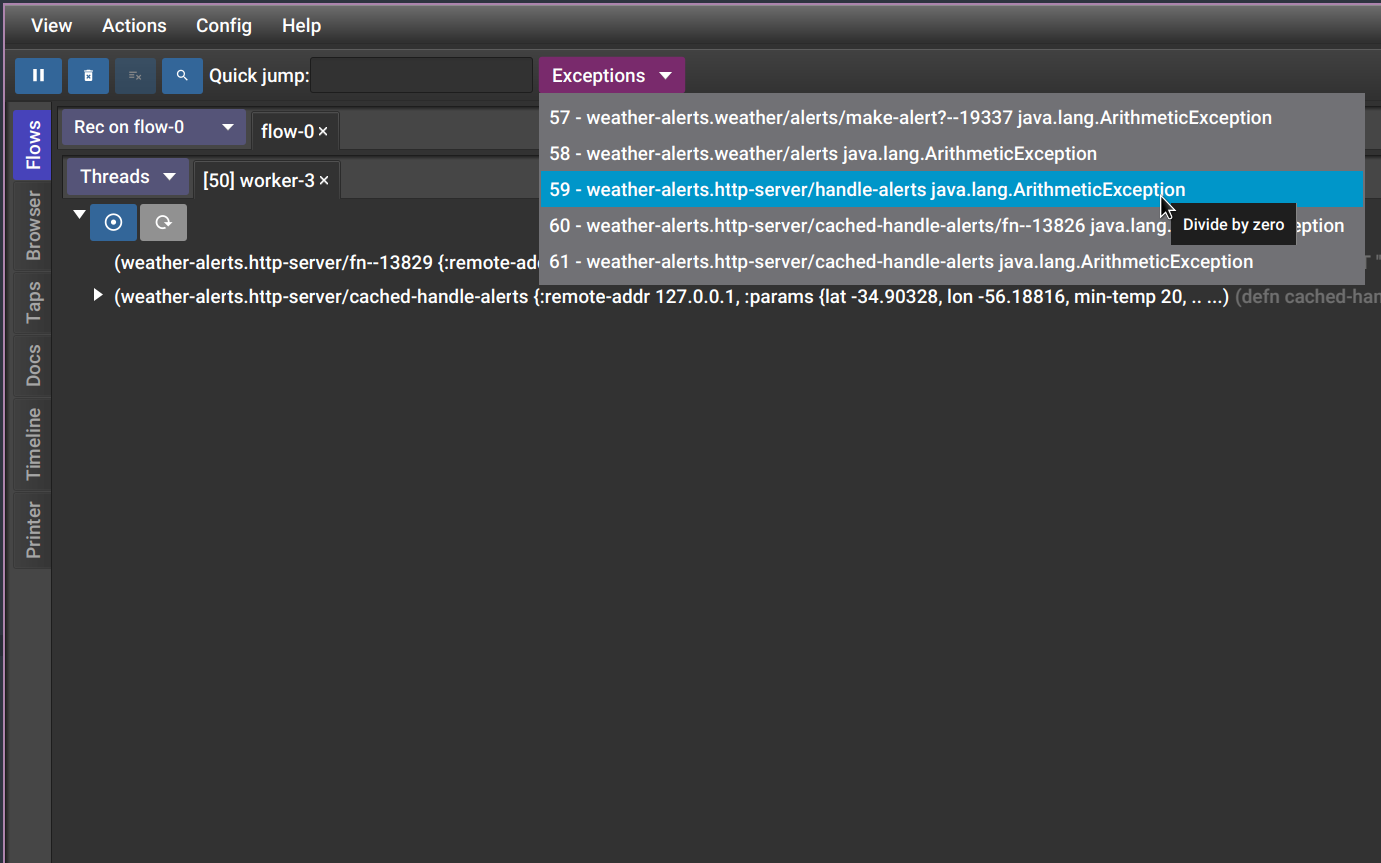
Learn MoreUnderstand your systems exceptions
Explore and jump to any exceptions throwed during the execution of your programs with a single click.
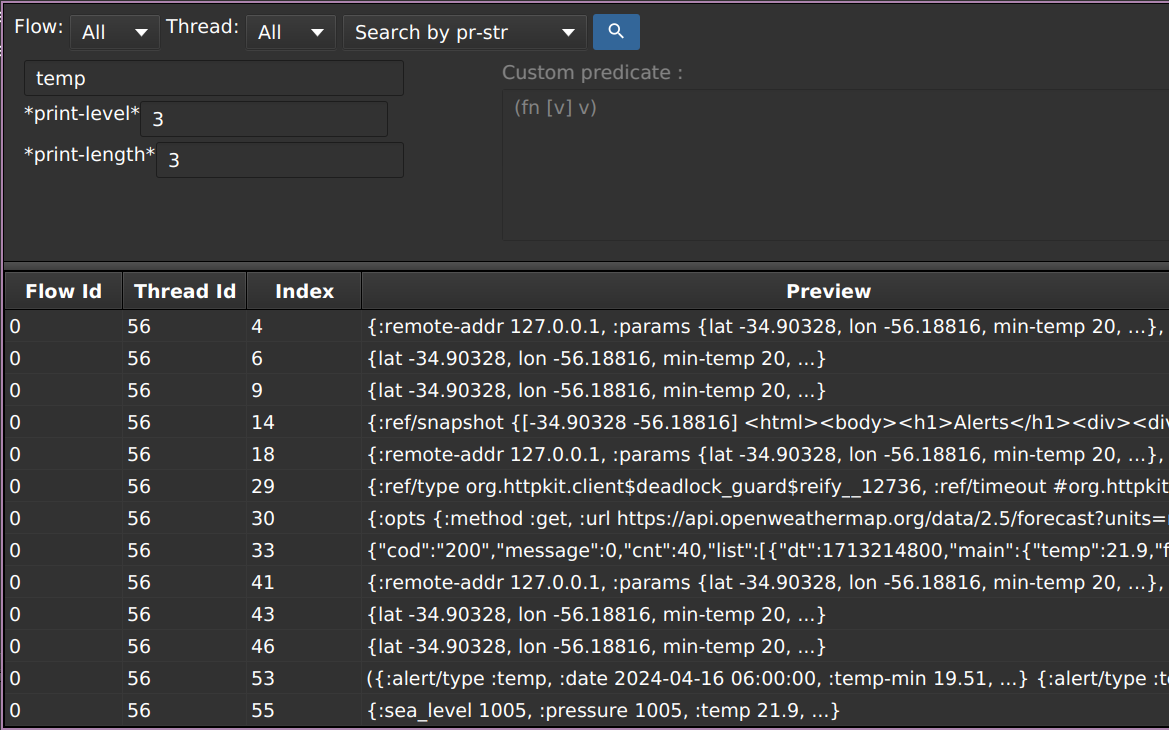
Learn MoreSearch any value
Search values by predicates or strings, and jump to their usages with a single click.
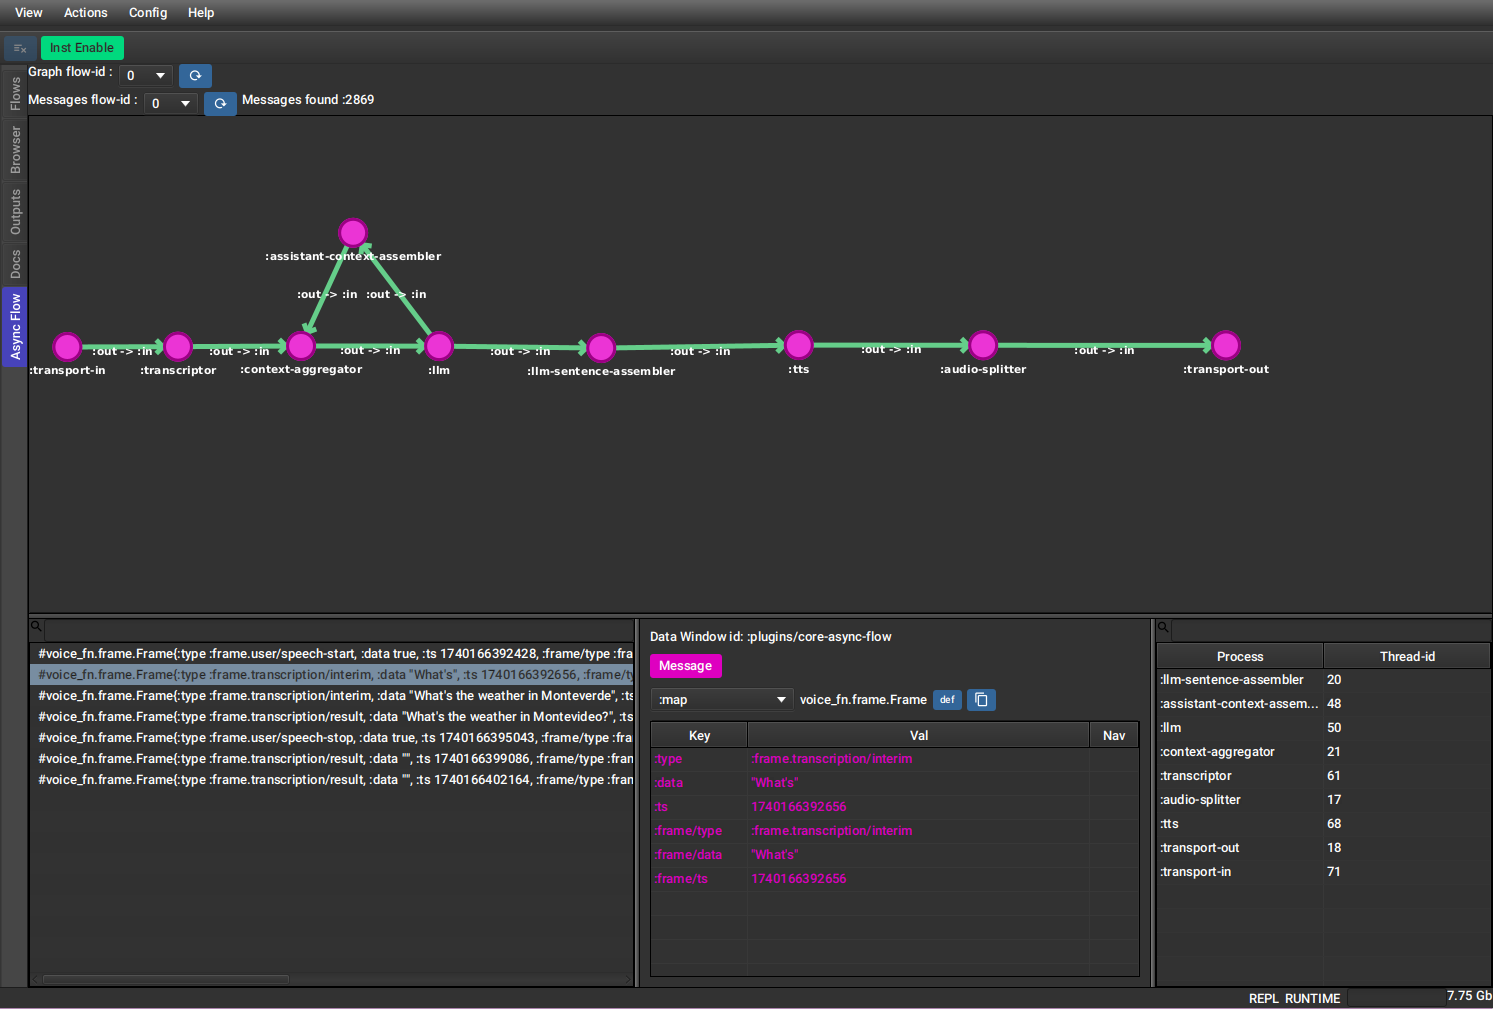
Learn MoreExtend it to your domains
A plugin system allows you to extend how you visualize and interact with your recordings for specific domains.
Learn More